Prometheus Metrics
This section presents the metrics exposed by Liqo, using the Prometheus format. Although in this page we suppose Prometheus is running in your cluster, please note that this is not strictly required: metrics can be scraped also by an external Prometheus server, with Liqo metrics exposed through a dedicated endpoint.
Scraping metrics
Gathering of Liqo metrics is disabled by default.
To enable the scraping of Liqo metrics, you should set the --enable-metrics liqoctl flag during installation (cf. installation customization options).
In this case, Liqo assumes that you leverage the Prometheus Operator to run Prometheus, hence it creates also the proper ServiceMonitor and PodMonitor resources that are automatically associated to the components that export metrics (e.g., network gateway, virtual kubelet).
Finally, metrics are scraped depending on how your Prometheus server(s) has been configured.
If you need to finely tune the above settings, you should use Helm. For example, this can be useful if your Prometheus server is external to your cluster, hence you want simply to export the Liqo metrics to a public endpoint and scrape them from there. Refer to the Install with Helm section for further details.
Cross-cluster network metrics
These metrics are available for each peered remote cluster, providing statistics about the cross-cluster network interconnections:
liqo_peer_receive_bytes_total: the total number of bytes received from a remote cluster.
liqo_peer_transmit_bytes_total: the total number of bytes transmitted to a remote cluster.
liqo_peer_latency_us: the round-trip (RTT) latency between the local cluster and a remote cluster, in micro seconds, measured by a periodic UDP
pingbetween the two Liqo gateways and sent within the Liqo tunnel itself.liqo_peer_latency_histogram_us: like liqo_peer_latency_us, but exposed as a Prometheus histogram, allowing the computation of percentiles and other aggregations.
liqo_peer_is_connected: boolean keeping the status of the network interconnection between clusters, i.e., whether the peering is established and works properly, derived from the
pingmeasurement above.
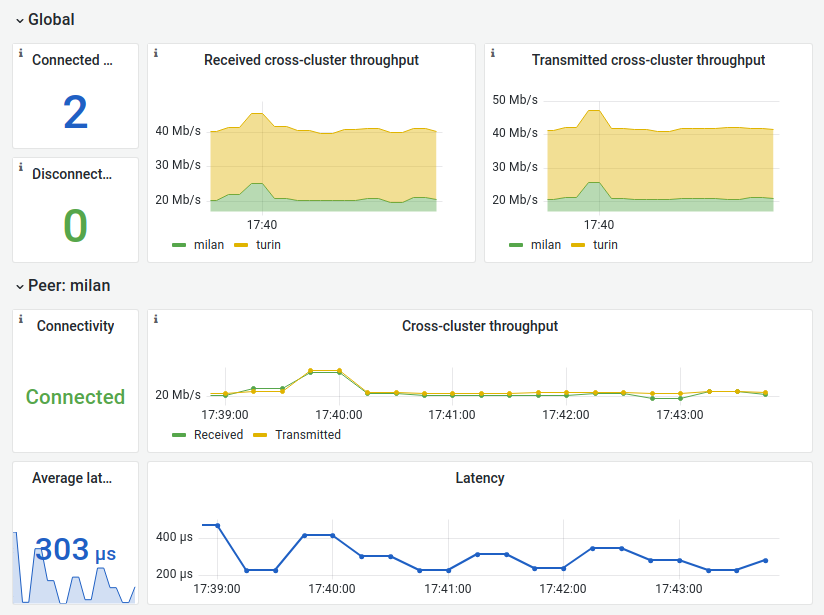
Grafana dashboard
We provide a sample Grafana dashboard to monitor the network interconnection of an arbitrary number of Liqo peerings.
As presented in the screenshot below, it includes an overview section presenting the overall cross-cluster throughput, followed by detailed per-peering throughput and latency information.
Virtual kubelet metrics
These metrics are available for each peered remote cluster, providing statistics about the reflected resources:
liqo_virtual_kubelet_reflection_item_counter: the number of resources that are currently successfully reflected (e.g., Pod, ConfigMap, Secret, Service, ServiceAccount, EndpointSlice, Ingress and PersistentVolumeClaim). This number can increase/decrease over time, and it may reach zero when two peered clusters have no reflected resources.
liqo_virtual_kubelet_reflection_error_counter: the number of transient errors during the reflection phase. Errors can occur due to temporary race conditions that can be resolved by retrying the synchronization. These conditions mainly occur when some of the requested resources are not yet fully configured (e.g., no reflector is found for the given namespace and no fallback is configured, the fallback is not completely initialized this happens if namespace reflectors still need to be started, and the reflector is not completely initialized because only one of the two informer factories has synced).
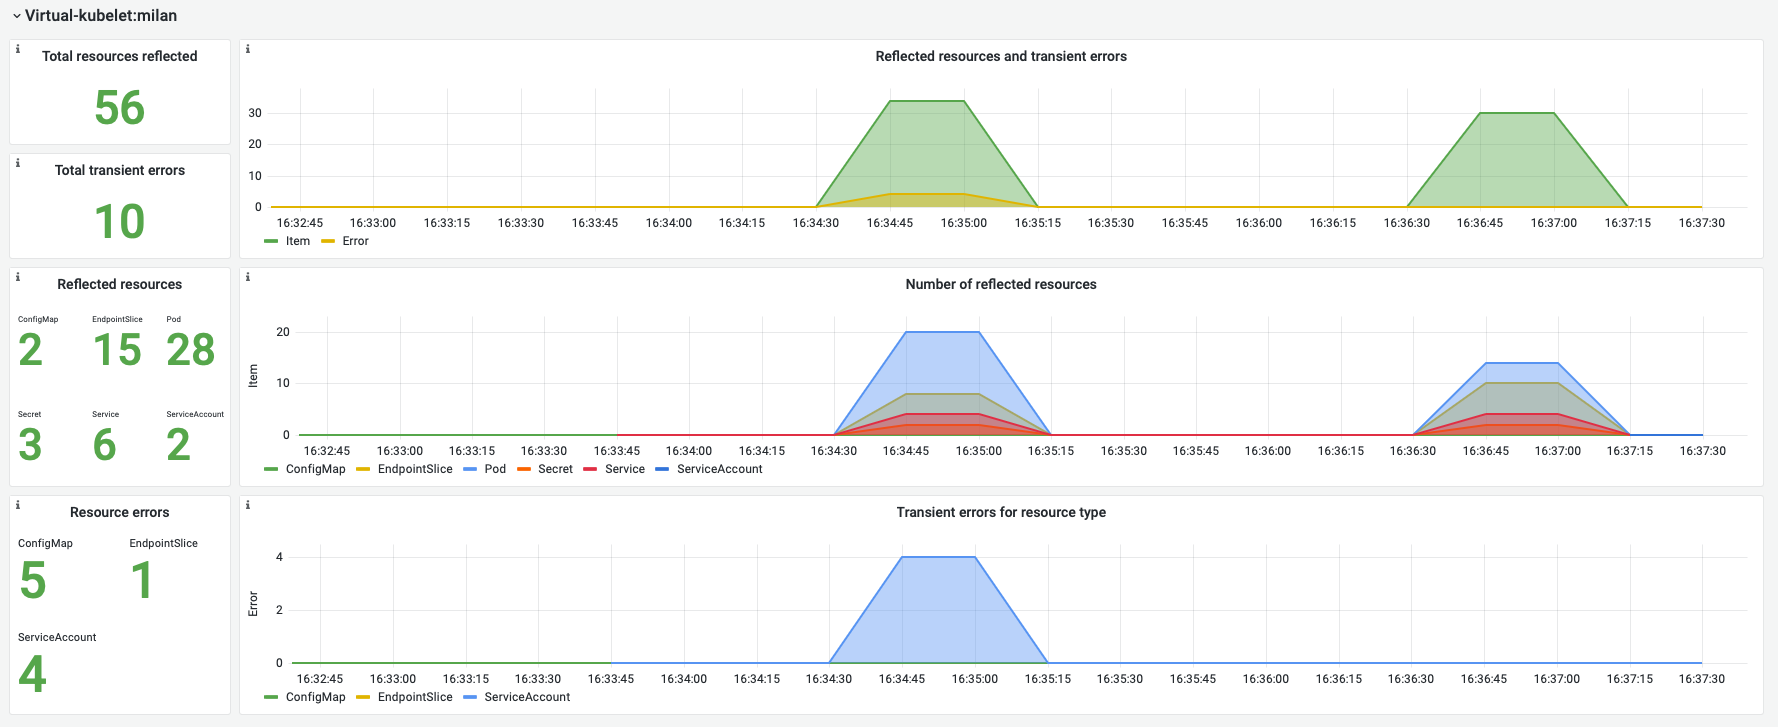
Grafana dashboard
We offer a sample Grafana dashboard that allows you to monitor the reflected resources for each component of the virtual-kubelet.
As shown in the screenshot below, it contains visual representations of the total number of reflected resources and the average rate per second.
Additionally, there are detailed tables that provide information on the total number of each type of resource, as well as an overall summary of all reflected items during a certain time period.