Prometheus Metrics
This section presents the metrics exposed by Liqo components, using the Prometheus format.
Scraping metrics
How metrics are scraped will depend on how you are operating your Prometheus server(s). Liqo presumes that the Prometheus Operator is being used to run Prometheus, providing a ServiceMonitor resource for each component.
Metrics are disabled by default.
In order to allow Prometheus to scrape metrics from the Liqo components, you should set the --enable-metrics liqoctl flag during installation (cf. installation customization options).
This flag enables the metrics exposition and the ServiceMonitor resources creation.
Alternatively, it is possible to customize these settings using Helm (refer to the Install with Helm section for further details).
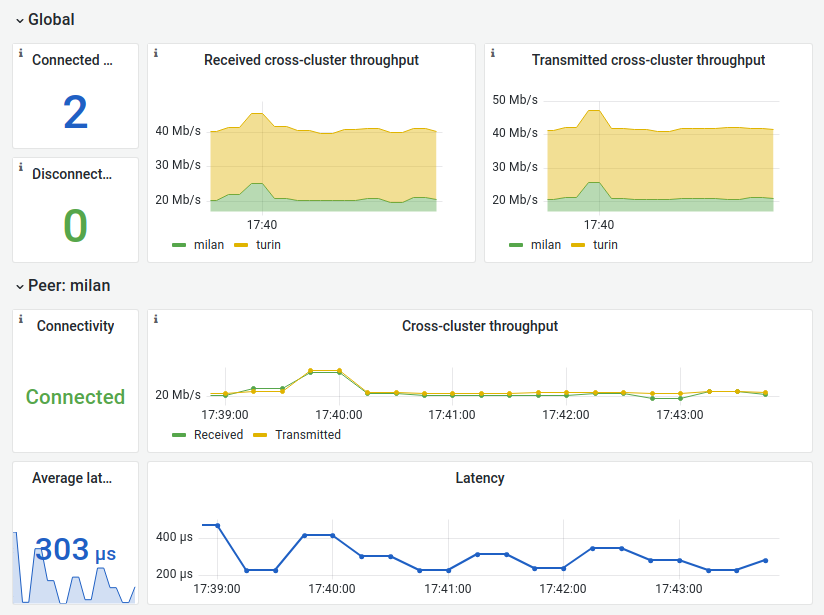
Cross-cluster network metrics
These metrics are available for each peered remote cluster, providing statistics about the cross-cluster network interconnections:
liqo_peer_receive_bytes_total: the total number of bytes received from a remote cluster.
liqo_peer_transmit_bytes_total: the total number of bytes transmitted to a remote cluster.
liqo_peer_latency_us: the latency between the local cluster and a remote cluster.
liqo_peer_is_connected: whether the network interconnection is established and works properly.
Grafana dashboard
We provide a sample Grafana dashboard to monitor the network interconnection of an arbitrary number of Liqo peerings.
As presented in the screenshot below, it includes an overview section presenting the overall cross-cluster throughput, followed by detailed per-peering throughput and latency information.